18th March 2010, 11:05 pm
According to Hitwise Facebook overtook Google in market-share although Alexa still ranks Google as the most visited website. Since Alexa’s data source tends to be more comprehensive/accurate Hitwise probably jumped the gun but might be right in upcoming months.

Category:
Search |
Comments Off on Facebook more Popular than Google
8th March 2010, 03:43 pm
Google now lets users crunch public data with the data visualization tools it acquired when it bought Trendalyzer from the Gapminder Foundation (see my March 2006 entry ‘Qualitative Data Analysis‘). The ‘Public Data Explorer‘ is a new solution in Google Labs that lets users create interactive charts using data sets from the World Bank, the U.S. Census Bureau, California Department of Education and 13 other agencies. The GUI – in typical Google fashion – is rudimentary. And there does not seem to be too much data in there yet. Still I could have used that for my presentation on cultural differences last month.
Category:
Search |
Comments Off on Data Visualization Software Powered by Google
4th March 2010, 11:29 am
Below is a screenshot for a custom business and web analysis dashboard I created for Verizon Wireless. The goal for this dashboard is to provide actionable real-time data through the conversion of page information into product, service and support information across the two main markets of the company. A secondary dashboard correlates the web support data with call center data.
I expect that call center volumes can be decreased by as much as 25% (for product launch months).
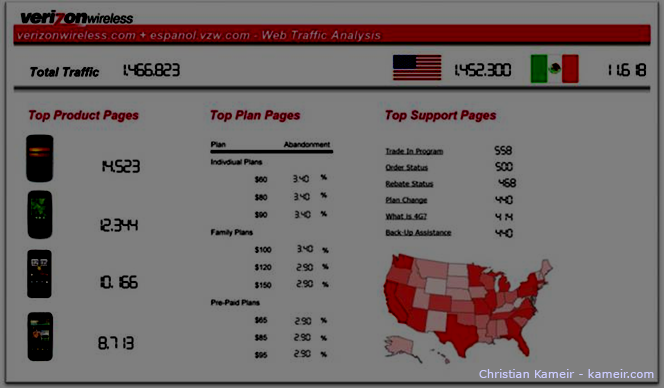
Data-sources: SiteCatalyst, Google Analytics, DoubleClick, Custom DBs
Category:
Web Analytics |
Comments Off on Reducing Custom Care Cost using Analytics